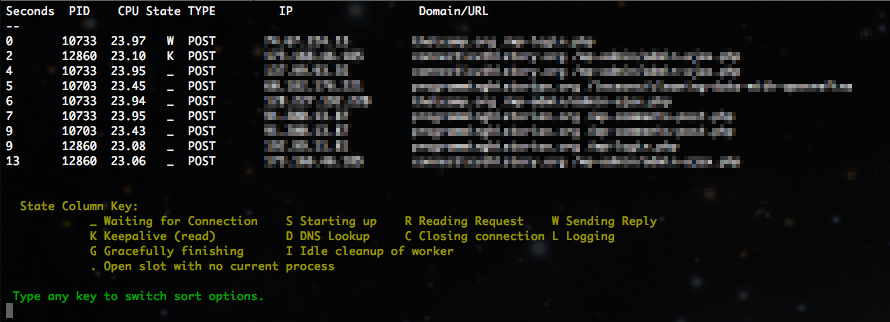
When I first became a systems administrator of a large web server, I wanted to know what the current traffic to all of the virtual hosts (vhosts) looked like. I wanted to see which domains were getting the most traffic and where that traffic was coming from. So began my long search for a sufficient tool. There are many out there (apache-top, Apachetop, wtop, htop, IPTraf, etc). But they didn’t do all of the things I wanted. Basically they were just command line versions of the output of Apache mod_status, or they did complex log analysis.
I wanted more. The ability to search, or show only a certain domain name, see a list of IP address and how many connections from that IP address (to detect botnet attacks), and more.
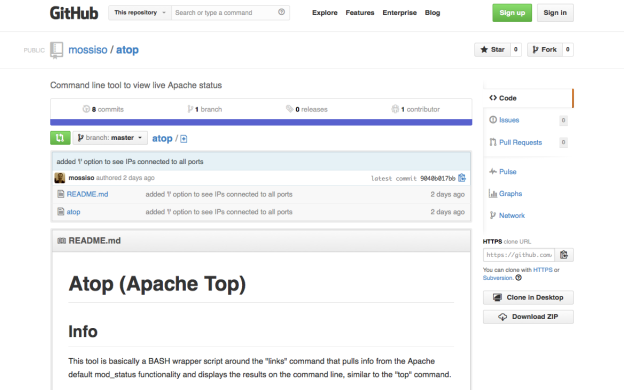
So in true sys admin fashion, I built the tool myself. It is sufficiently stable and usable enough to warrant a blog post and hopefully engender some usage by others, which hopefully will encourage ideas and improvements from the community. Go ahead and grab a copy from the github repo, https://github.com/mossiso/atop
My idea is not much different than some of the tools I linked to. I’m basically writing a wrapper around the Apache mod_status output, but this tool has the ability to do more. So here’s a little walk through of what this tool does.
Requirements
- Apache with mod_status: This tool is built around the Apache mod_status output, so that obviously has to be installed and set up. The ExtendedStatus option has to be enabled in the httpd.conf file.
- links: This is a command line based web browser of sorts. Using the -dump flag, it just spits out the page to the command line.
- netstat: This is used for one of the options to display all of the IPs connected to the webserver (via port 80).
This tool is just a BASH script, so once you download the “atop” file, just plop it anywhere in your home directory on your web server, change the permissions so it is executable
[code lang=”bash”]chmod 700 atop[/code]
and run it
[code lang=”bash”]./atop[/code]
There are now several options you can sort the results by:
==============================================================
a = sort all threads by time
c = sort by CPU, no GCRK_
i = list IPs connected to port 80 (uses Apache Server Status)
k = sort by K (Keep alives)
l = list IPs connected to all ports (uses netstat)
n = list IPs connected to port 80 (uses netstat)
o = sort open connections by CPU
p = sort only POST threads by time
r = raw apache status output (good with limit of at least 50)
s = search for a term, returns raw Apache Server Status results
w = sort by inactive workers
q = quit
To see the list of options while the command is running, just type any key on the keyboard.
Getting the BASH script to be responsive to the keyboard was tricky, and took me the longest time to figure out. For a while I could get the results to be displayed and refresh every N seconds, I could even get it to do the sort options, but only if I started the script with that option. So I was super excited to figure out the logic to get the script to respond to input.
The trick lies in setting the output commands in an infinite while loop. At the end of the loop it does a regular bash prompt using “read”. Normally this waits for a response, but the timeout feature allows you to set that to one second, which then goes through the while loop again. If a key is pressed, it breaks the while loop and prints the options message. When an option is selected it goes through that while loop.
Features
Some of the sort options I use most often are POST (p), CPU (c), IPs according to Apache (i), and IPs according to the server (n). I walk through those one by one.
POST
This is probably the most helpful of the options. Usually, when a website is getting hammered, it’s because it is getting comment spam or login attempts. These all require POST requests. If you see a large number of POST requests for a single vhost, then look at the IP addresses sending the requests; you can bet if all the requests are from the same IP, that it should be blocked.
CPU
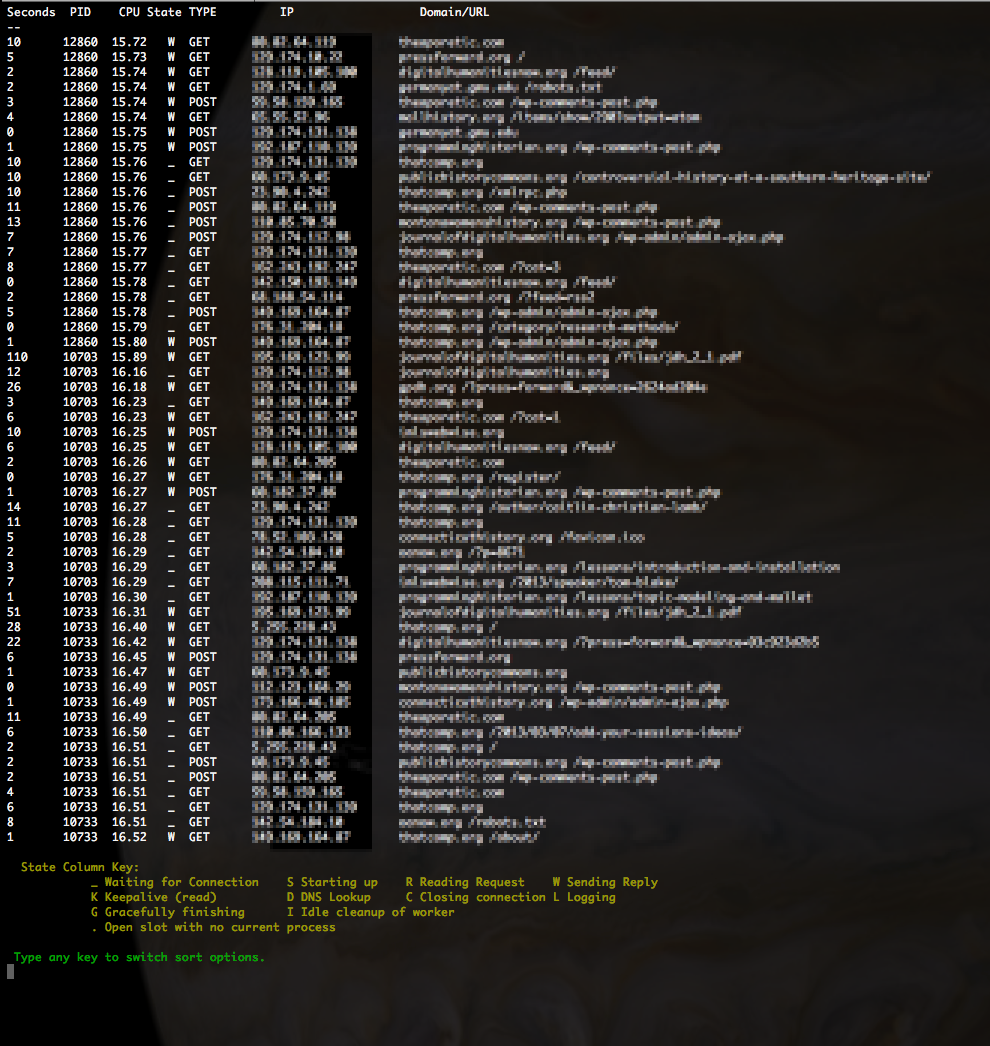
This is a pretty good overview of what Apache traffic your server is handling. It shows GET and POST requests and sorts them with the most heavy CPU usage requests on the bottom. It filters out open processes with no connections, and a few other things like closing connections.
IPs (Apache)
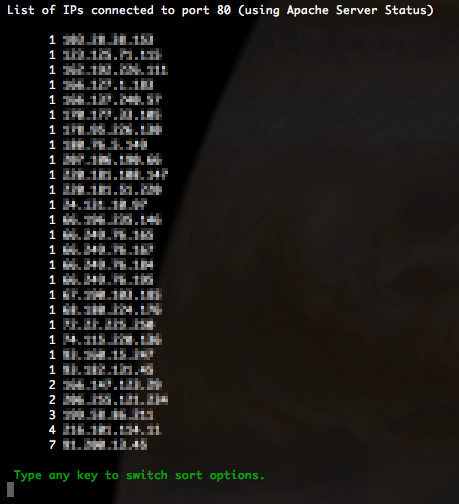
This one is great, too. It shows the IP addresses that are connected to Apache, and sorts them by how many connections are being made. The IPs with the most connections are at the bottom. If you see an IP address with over 10 connections for a few minutes, you can bet they are up to no good. Double check with the POST option to see if they are spamming.
IPs (Netstat)
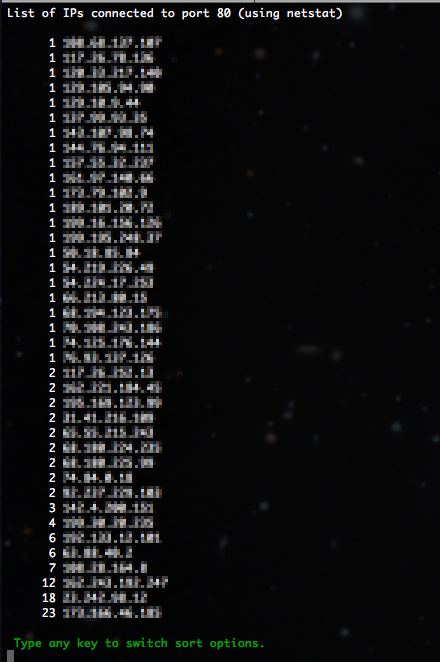
This option gets all traffic to port 80 using netstat. It filters out local traffic (and GMU traffic, but you can edit that out), and then does the sorting and organizing by how many IP addresses are connecting. This gives a little more detail than the other IP option.
If you find any bugs in the script or have a great idea for other options, feel free to fork or submit patches, or report bugs on the github repo.
